Frequently asked questions
Frequently asked questions
General
-
Can I connect to a device by directly typing in its IP address?
Yes. In the iPad app, simply tap on the '...' button which appears in the bottom left corner of the "Select your device" screen, then choose "Other device...". Ports 27182-27186 must be open to connect to a device on a different subnet.
-
WiFi is not permitted in our lab. How can I use Moku:Lab?
In some places, WiFi networks are not permitted for either security or interference reasons. However, you can still use Moku:Lab fully.
1 — Disabling Wifi in Moku:Lab
There are two ways to disable the Moku:Lab wifi.
EITHER, on the bottom of the Moku:Lab; there is an ‘airplane’ mode button. Depress this recessed button with a paperclip or similar and the WiFi of Moku:Lab will be disabled.
OR, in the iOS app, connect to the Moku:Lab and under device settings; select the ‘ethernet’ tab and ensure that ethernet access is enabled. Then under the WiFi tab disable both “Join a WiFi network” and “Create a WiFi network”.
2 — Using Moku:Lab without WiFi
A. You may access Moku:Lab via wired ethernet using Python, MatLab and LabView APIs
B. To have the benefit of the iOS app interface and interact with the instruments’ user interface, we will need to connect the iPad via a wired connection. To do this, use the micro-USB port on the back panel of the Moku:Lab and an Apple ‘Lightening to USB camera adaptor’ or a USB-C to micro B USB cable. Full details can be found in the application note. -
I don't have an iPad. Can I still use Moku:Lab?
Yes! You can interact with Moku:Lab using Python, LabVIEW and MATLAB from any computer running Mac OS, Windows or Linux.
-
What are the minimum requirements for an iPad to be able to run Moku:Lab?
The minimum requirements are an iPad Air, or iPad mini 2 or newer, running iOS 8.2 or later. Choose your model from www.apple.com/ipad
-
All of my lab computers run Windows. Will I need to change them all to Mac OS?
No, Moku:Lab works perfectly well in a Windows lab environment. You can transfer data to your Windows computer via email or Dropbox using the the in-app sharing button. Or use our Python library to integrate Moku:Lab into your Windows-based experiment control system.
-
How do I ensure that I have the latest iPad app software?
Simply go to the app store and download any updates, if available. The app store will always have the latest iPad software and include the most up to date instruments for the Moku:Lab.
-
How I ensure that I have the latest instruments on my Moku:Lab?
The iPad app contains all the instruments, so to ensure that you have the latest set of instruments simply visit the App Store and ensure your iPad is up to date. The iPad app will ensure that Moku:Labs are up to date each time the iPad connects to a Moku:Lab.
-
How do I locate my Moku in a lab with many Mokus?
In a lab with several Mokus, it is possible to loose track of which Moku you are controlling on the iPad. The colored LEDs on the bottom of each Moku make device identification easy. Goto ‘select your device’ and each Moku on your local network will be displayed; outlined with a colored circle, the color matching the Mokus bottom lighting LEDs. By selecting a Moku and going to ‘device settings’, you can change the LED colors of each Moku such that they are readily identifiable. In the device settings you can also assign a unique name and a password.
-
Can I indicate where I am touching the iPad’s screen while presenting with Moku:Lab?
Yes! Your audience can better follow your presentation once the built-in touch point feature is enabled.
General
-
Can I connect to a device by directly typing in its IP address?
Yes. In the iPad app, simply tap on the '...' button which appears in the bottom left corner of the "Select your device" screen, then choose "Other device...". Ports 27182-27186 must be open to connect to a device on a different subnet.
-
WiFi is not permitted in our lab. How can I use Moku:Lab?
In some places, WiFi networks are not permitted for either security or interference reasons. However, you can still use Moku:Lab fully.
1 — Disabling Wifi in Moku:Lab
There are two ways to disable the Moku:Lab wifi.
EITHER, on the bottom of the Moku:Lab; there is an ‘airplane’ mode button. Depress this recessed button with a paperclip or similar and the WiFi of Moku:Lab will be disabled.
OR, in the iOS app, connect to the Moku:Lab and under device settings; select the ‘ethernet’ tab and ensure that ethernet access is enabled. Then under the WiFi tab disable both “Join a WiFi network” and “Create a WiFi network”.
2 — Using Moku:Lab without WiFi
A. You may access Moku:Lab via wired ethernet using Python, MatLab and LabView APIs
B. To have the benefit of the iOS app interface and interact with the instruments’ user interface, we will need to connect the iPad via a wired connection. To do this, use the micro-USB port on the back panel of the Moku:Lab and an Apple ‘Lightening to USB camera adaptor’ or a USB-C to micro B USB cable. Full details can be found in the application note. -
I don't have an iPad. Can I still use Moku:Lab?
Yes! You can interact with Moku:Lab using Python, LabVIEW and MATLAB from any computer running Mac OS, Windows or Linux.
-
What are the minimum requirements for an iPad to be able to run Moku:Lab?
The minimum requirements are an iPad Air, or iPad mini 2 or newer, running iOS 8.2 or later. Choose your model from www.apple.com/ipad
-
All of my lab computers run Windows. Will I need to change them all to Mac OS?
No, Moku:Lab works perfectly well in a Windows lab environment. You can transfer data to your Windows computer via email or Dropbox using the the in-app sharing button. Or use our Python library to integrate Moku:Lab into your Windows-based experiment control system.
-
How do I ensure that I have the latest iPad app software?
Simply go to the app store and download any updates, if available. The app store will always have the latest iPad software and include the most up to date instruments for the Moku:Lab.
-
How do I locate my Moku in a lab with many Mokus?
In a lab with several Mokus, it is possible to loose track of which Moku you are controlling on the iPad. The colored LEDs on the bottom of each Moku make device identification easy. Goto ‘select your device’ and each Moku on your local network will be displayed; outlined with a colored circle, the color matching the Mokus bottom lighting LEDs. By selecting a Moku and going to ‘device settings’, you can change the LED colors of each Moku such that they are readily identifiable. In the device settings you can also assign a unique name and a password.
-
Can I indicate where I am touching the iPad’s screen while presenting with Moku:Lab?
Yes! Your audience can better follow your presentation once the built-in touch point feature is enabled.
Hardware
-
Are the inputs of the Moku:Lab protected?
Yes, the Moku:Lab's does have front-end protection to reduce the chances of accidental damage to the ADCs. Each input has a sensing circuit that protects it from over voltage events. If a voltage beyond ±7.5 V is present then the inputs will be disconnected within about 10 ms. Once disconnected, the Moku:Lab is protected up to voltages of 30V DC.
-
How do I update Moku:Lab’s firmware?
Moku:Lab firmware updates require a restart, and may take up to 45 minutes to complete. Do not turn off Moku:Lab during this time.
If the power is inturrupted during a firmware update, yourMoku:Lab may boot into recovery mode.
To restore the device, connect your iPad to the WiFi network called “Moku:Recovery”. When the device becomes visible, you will be prompted to resume the firmware update process. -
Moku:Lab has an FPGA inside it. Can I get access to the FPGA to execute my own code?
Sorry, not yet. We hope to bring you this capability in the future. We won't do anything to stop you running your own code but we are unable to support it at this time. If this feature is important to you please let us know, but for now Moku:Lab is designed to work out of the box in the same way as conventional test and measurement instruments like oscilloscopes and waveform generators.
-
How I ensure that I have the latest instruments on my Moku:Lab?
The iPad app contains all the instruments, so to ensure that you have the latest set of instruments simply visit the App Store and ensure your iPad is up to date. The iPad app will ensure that Moku:Labs are up to date each time the iPad connects to a Moku:Lab.
-
My Moku:Lab does not turn on! Can you help?
After connecting the power adaptor to an outlet and to the rear of the Moku:Lab, ensure you push and HOLD the front panel Liquid Instruments logo button until the front LED is orange (approx 2 seconds). The Moku:Lab will now boot. Once the LED turns white/blue (approx 1 minute), Moku:Lab is ready to use.
-
What if Moku:Lab fails to start?
If Moku:Lab fails to start or boot correctly, it will show a steady orange LED on the power switch for more than 2 minutes after power up. If this is so, you will need to perform a Hard Reset as explained here.
-
Is Moku:Lab calibrated?
Moku:Lab is calibrated by Liquid Instruments at the factory. In addition, Liquid Instruments has collaborated with Tektronix to enable ISO/IEC 17025 calibration and re-calibration of Moku:Lab.
For new purchases: Within the US; you may select Tektronix 17025 calibration at the time of purchase and your new Moku:Lab will be delivered complete with 17025 calibration and NIST traceable certification. Outside of the US; please contact us to make arrangements.
For recalibration: Please contact us or Tektronix directly at mvs@tek.com or call 1-877-477-8204.
Arbitrary Waveform Generator
-
How can I upload custom waveforms from my iPad?
You can load from your iPad's clipboard, the "Files app", or choose from files saved directly on the Moku:Lab's SD card.
-
What file formats are supported?
Files formatted with comma- or newline-delimited text.
Arbitrary Waveform Generator
-
How can I upload custom waveforms from my iPad?
You can load from your iPad's clipboard, the "Files app", or choose from files saved directly on the Moku:Lab's SD card.
-
What file formats are supported?
Files formatted with comma- or newline-delimited text.
Data Logger
-
How long can I record for?
Moku:Lab’s Data Logger is limited only by storage. The Moku:Lab has 500MB of internal storage and can also log to an SD card of any size. Note though that most SD cards use the FAT32 filesystem, which is limited to a maximum file size of 4GB.
Recording a single channel at minimum rate to a binary file, this gives you approximately 4 months of recording to internal storage, up to 2.5 years to an SD card.
-
How can I read data from .li files?
The LI File Converter can be used to convert binary data from a .li file into plain text data in CSV (comma-separated values) format, or to a MATLAB .mat file. You can download it on the utilities page.
-
How can I import a CSV file from Moku:Datalogger into MATLAB?
If you only need the data itself, simply type ""load yourfile.csv"" at the MATLAB command prompt. CSV files generated by Moku:DataLlgger also contain a text header with information about when the data was recorded, the instrument settings, and what each column in the data represents. If you want to import this metadata as well, use the command “moku = importdata('yourfile.csv')”
Digital Filter Box
-
Can I load my own filter coefficients?
Yes! Moku:Lab’s Digital Filter Box implements infinite impulse response (IIR) filters using 4 cascaded Direct Form I second-order stages with a final output gain stage. To specify a filter, you must supply a text file containing the filter coefficients. The file should have six coefficients per line, with each line representing a single stage. If output scaling is required, this should be given on the first line. Each coefficient must be in the range [-4.0, +4.0). Internally, these are represented as signed 48-bit fixed-point numbers, with 45 fractional bits. The output scaling can be up to 8,000,000. Filter coefficients can be computed using signal processing toolboxes in e.g. MATLAB or SciPy.
-
How are the filters implemented?
The Digital Filter Box implements infinite impulse response (IIR) filters using four cascaded Direct Form I second-order stages with a final output gain stage. To specify a filter, you must supply a text file containing the filter coefficients. The file should have six coefficients per line, with each line representing a single stage. If output scaling is required, this should be given on the first line.
FIR Filter Box
-
Can I load my own filter coefficients?
Yes, you can input your filter coefficients by putting your kernel into a CSV file.
-
Can I also create IIR filters?
While this instrument (FIR Filter Builder) is used to design FIR filters, you can use the Digital Filter Box to create IIR filters.
Frequency Response Analyzer
-
How can I plot the ratio of Input 1 and Input 2?
By default, each channel shows the ratio of the input to the output, In / Out. This is useful for measuring the transfer function of a device under test. The math channel allows you to plot different combinations of Ch 1 and Ch 2. If the output amplitudes of both channels are set to the same value, then viewing the math channel as Ch 1 / Ch 2 will show the ratio In 1 / In 2, since the outputs are the same.
-
How does frequency response amplitude scaling work?
The Frequency Response Analyzer (FRA) provides response plots of magnitude and phase. While the phase is expressed in degrees, the magnitude is expressed in terms of dBm power. This is a log scale of power expressed in dB relative to 1 milliWatt.
How is this magnitude in dBm calculated in Moku:Lab’s FRA?
Let us take a simple example. We will set the swept sine wave output of the FRA to 1Vpp, configure 50 Ω input and output impedance and for this example, a sweep from 10Hz to 1kHz. Then with a coax cable connecting output 1 of the Moku:Lab to input 1, we run a sweep of the FRA. You should see a flat amplitude response at 4.0 dBm.
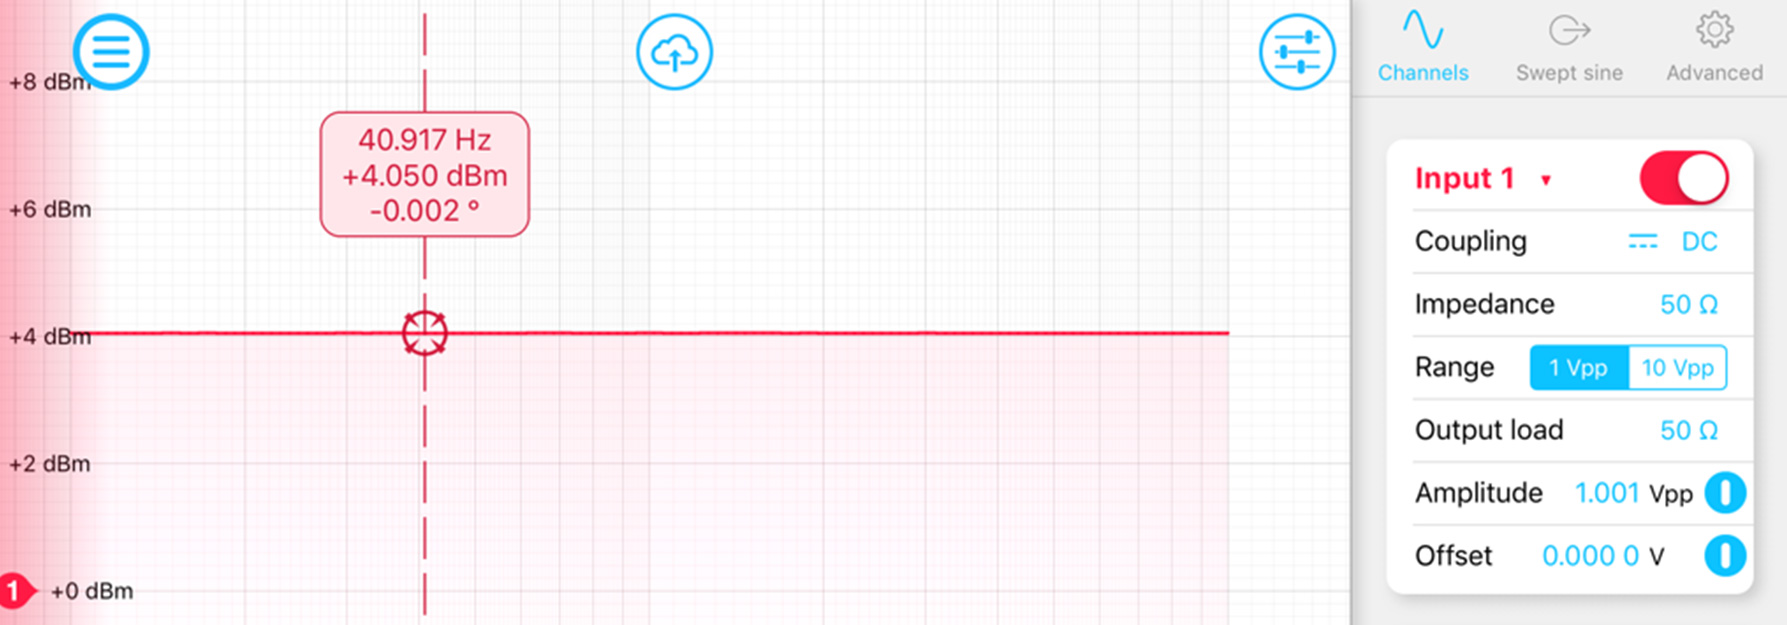
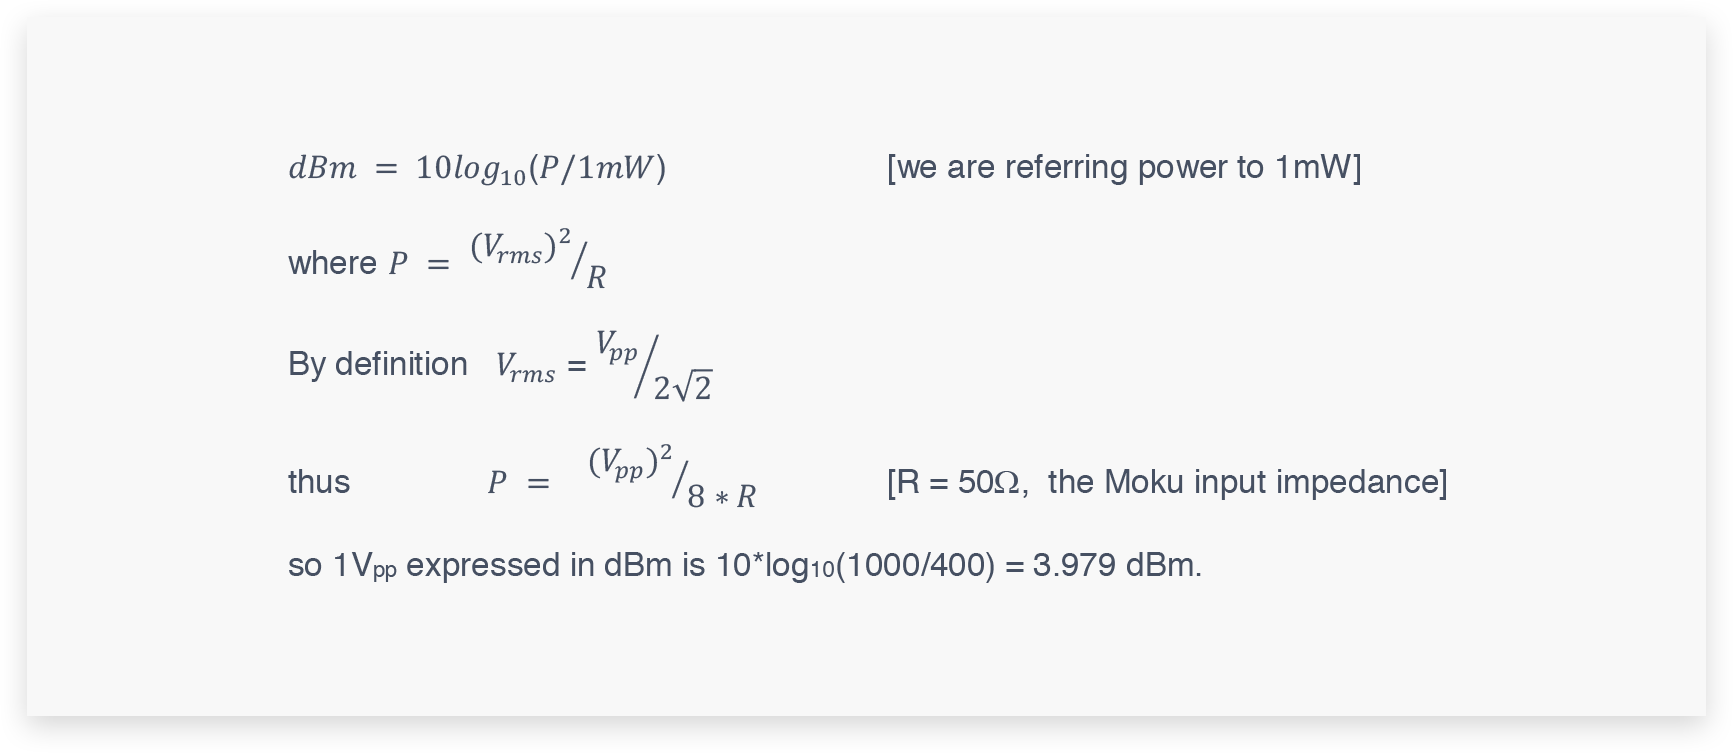
How is the 4.0 dBm is calculated?
It comes from this formula (valid for sinusoidal signals):
Frequency Response Analyzer
-
How can I plot the ratio of Input 1 and Input 2?
By default, each channel shows the ratio of the input to the output, In / Out. This is useful for measuring the transfer function of a device under test. The math channel allows you to plot different combinations of Ch 1 and Ch 2. If the output amplitudes of both channels are set to the same value, then viewing the math channel as Ch 1 / Ch 2 will show the ratio In 1 / In 2, since the outputs are the same.
-
How does frequency response amplitude scaling work?
The Frequency Response Analyzer (FRA) provides response plots of magnitude and phase. While the phase is expressed in degrees, the magnitude is expressed in terms of dBm power. This is a log scale of power expressed in dB relative to 1 milliWatt.
How is this magnitude in dBm calculated in Moku:Lab’s FRA?
Let us take a simple example. We will set the swept sine wave output of the FRA to 1Vpp, configure 50 Ω input and output impedance and for this example, a sweep from 10Hz to 1kHz. Then with a coax cable connecting output 1 of the Moku:Lab to input 1, we run a sweep of the FRA. You should see a flat amplitude response at 4.0 dBm.
How is the 4.0 dBm is calculated?
It comes from this formula (valid for sinusoidal signals):
Laser Lock Box
-
If Moku:Lab only has two output channels, how is it possible to generate feedback control signals as well as the modulation tone and scanning waveform?
The low-bandwidth control signal on output Channel 2 can be separated electronically from the high-frequency modulation tone using an external bias-tee (not included with Moku:Lab). An appropriate bias-tee can be purchased from Mini-Circuits.
The scanning waveform is typically applied to the same actuator as the high-bandwidth control signal, so no bias-tee is required to separate the two signals. -
Can I adjust the corner frequency of the low-pass filter?
Yes! The low-pass filter corner frequency can be tuned from 1 kHz to 14 MHz. You can also select different filter types including Chebyshev II and Elliptic filters that can be used to notch troublesome resonances.
-
What laser locking techniques does the Laser Lock Box support?
The Laser Lock Box supports a number of different locking techniques including Pound-Drever-Hall (PDH) locking, Heterodyne offset phase locking, RF locking and Dither locking.
-
Does it lock frequency or phase?
The Laser Lock Box can be used to phase-lock lasers (e.g., offset phase locking) or to lock to a reference cavity (Pound-Drever-Hall locking).
-
Can I demodulate with an external reference?
Yes! The Laser Lock Box supports direct demodulation with an external source and demodulation with a phase-locked loop (PLL) locked to an external source.
-
Does it lock continuous wave and pulsed lasers?
Moku:Lab's Laser Lock Box can be used to stabilize the frequency of continuous wave lasers.
-
What if my actuator can't take negative voltages?
The Laser Lock Box has output voltage limiters designed for exactly this purpose. You can set arbitrary high and low limits on each output and the control signals will be clamped to these levels, preventing damage to sensitive actuators. Note that the modulation signal from the auxiliary oscillator is not clamped to avoid clipping and distortion.
-
When and how should I use the slow PID controller?
When stabilizing lasers, there are often multiple actuators to feed back to. A common situation is to have one fast actuator with limited range (e.g. current or piezo) and one slow actuator with a much larger range (e.g. temperature). The slow PID controller acts on the fast PID controller's output, keeping it centered around zero and thus maximizing the dynamic range for fast feedback.
Lock-in Amplifier
-
Can I adjust the corner frequency of the low-pass filter?
Yes! It is adjustable from 300 mHz to 4.97 MHz via an iPad, Python or Matlab.
-
What is the maximum rate at which I can save data, and how many points can I save?
The sample rate is dynamically adjusted by the horizontal zoom of the display, and can be set up to the full ADC sample rate of 500 MS/s. Currently you can save 16k points for two channels simultaneously.
-
Can the Lock-in Amplifier demodulate using an external source?
Yes!! The September 2017 software update added support for direct demodulation with an external source, demodulation with a PLL (Phase-locked loop) locked to an external source, and the ability to modulate and demodulate at different frequencies.
-
Does the Lock-in include a PID controller for feedback applications?
Yes! A PID controller was added in the September 2017 update. Update your iPad App to get all the new goodies.
-
The Lock-in can readout I and Q (X and Y). What about R and theta?
Following the September 2017 free update, to switch from an X and Y readout to R and theta on the Moku:Lab App, tap the X Y block on the block diagram.
Oscilloscope
-
Can I set the channel offset in screen divisions while zooming?
To zoom in and out while keeping the channel offset fixed on the screen, simply pan up or down with two fingers held together. This 'rapid zooming' technique works horizontally and on other instruments as well!
-
What is the difference between "Normal" and "Precision" acquisition modes?
Moku:Lab records samples from the analog inputs at a rate of 500 MS/s. When looking at long time spans, the data's sample rate is reduced to display the trace on the screen. In "Normal" acquisition mode, the input is simply downsampled; that is, only every Mth sample is taken. This can cause aliasing of high frequency signals: for example, a high frequency sine wave may appear as a lower frequency sine wave when the oscilloscope timebase is zoomed out. In "Precision" mode, the input is lowpass filtered (averaged) before downsampling. This reduces aliasing artifacts and increases the resolution of the trace. Note that in this mode, high frequency signals can be filtered out, so the oscilloscope trace may appear to be zero even if a high frequency signal is present at the input..
-
What is timebase setting ‘roll’?
The ‘roll’ setting on the timebase control panel is especially useful for slowing changing signals, typically with a timebase of greater than approximately 100ms/div. Rather than responding to trigger events, the oscilloscope will provide a continuously scrolling signal display with the effective trigger point set at the far right of the trace display.
-
What measurements can the oscilloscope make?
The oscilloscope is capable of making a wide range of measurements on both input channels and also the math channel. Tap the tape measure icon to add a measurement; tap and hold a measurement to configure. See
. Measurements include : Frequency, Period, Duty Cycle, Pulse Width, Negative Width, Mean, RMS, Cycle Mean, Cycle RMS, Standard Deviation, Peak to Peak, Amplitude, Maximum, Minimum, High Level, Low Level, Rise Time, Fall Time, Rise Rate, Fall Rate, Overshoot, Undershoot. -
What are the definitions of the Oscilloscope measurements?
Frequency
Frequency of the signal as determined by the time between rising or falling edges

Period
Time between pairs of rising or falling edges
Duty Cycle
Ratio of the time spent above the median to that spent below it
Pulse Width
Time the signal spends above the median
Negative Width
Time the signal spends below the median
Mean
Average value of the signal
RMS
Root-Mean-Square value of the signal
Cycle Mean
Average value of the signal, discounting partial cycles at the beginning and end of the frame
Cycle RMS
Root-Mean-Square value of the signal, discounting partial cycles at the beginning and edge of the frame
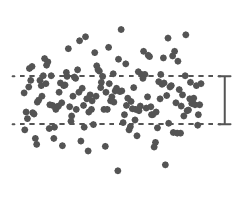
Standard Deviation
Mathematical description of the spread of the points in the signal
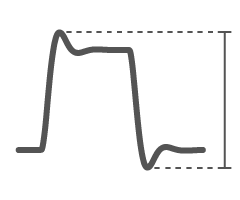
Peak to Peak
Difference between the highest and lowest voltage in the signal
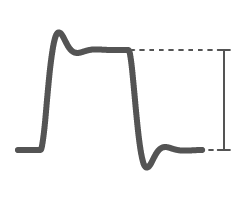
Amplitude
Difference between the high- and low-level voltage, excluding over- and undershoot
Maximum
Highest voltage in the signal
Minimum
Lowest voltage in the signal
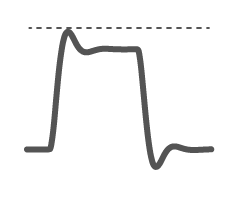
High Level
Highest voltage in the signal, excluding overshoot
Low Level
Lowest voltage in the signal, excluding undershoot
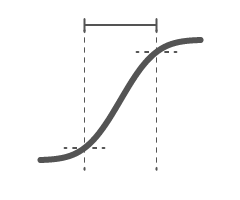
Rise Time
Time taken for the signal to transition from 10% to 90% of the way from minimum to maximum
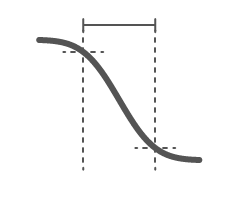
Fall Time
Time taken for the signal to transition from 90% down to 10% from maximum to minimum
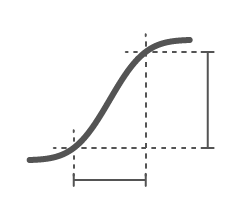
Rise Rate
Rate at which the signal transitions from 10% to 90% of the way from minimum to maximum
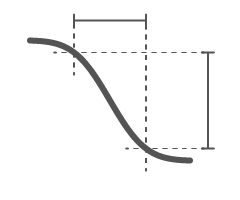
Fall Rate
Rate at which the signal transitions from 90% to 10% of the way from minimum to maximum
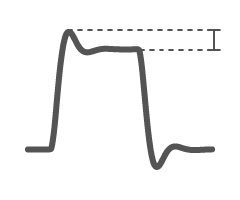
Overshoot
Distance the signal shoots above the maximum level before settling
Undershoot
Distance the signal shoots below minimum level before settling
Oscilloscope
-
Can I set the channel offset in screen divisions while zooming?
To zoom in and out while keeping the channel offset fixed on the screen, simply pan up or down with two fingers held together. This 'rapid zooming' technique works horizontally and on other instruments as well!
-
What is the difference between "Normal" and "Precision" acquisition modes?
Moku:Lab records samples from the analog inputs at a rate of 500 MS/s. When looking at long time spans, the data's sample rate is reduced to display the trace on the screen. In "Normal" acquisition mode, the input is simply downsampled; that is, only every Mth sample is taken. This can cause aliasing of high frequency signals: for example, a high frequency sine wave may appear as a lower frequency sine wave when the oscilloscope timebase is zoomed out. In "Precision" mode, the input is lowpass filtered (averaged) before downsampling. This reduces aliasing artifacts and increases the resolution of the trace. Note that in this mode, high frequency signals can be filtered out, so the oscilloscope trace may appear to be zero even if a high frequency signal is present at the input..
-
What is timebase setting ‘roll’?
The ‘roll’ setting on the timebase control panel is especially useful for slowing changing signals, typically with a timebase of greater than approximately 100ms/div. Rather than responding to trigger events, the oscilloscope will provide a continuously scrolling signal display with the effective trigger point set at the far right of the trace display.
-
What measurements can the oscilloscope make?
The oscilloscope is capable of making a wide range of measurements on both input channels and also the math channel. Tap the tape measure icon to add a measurement; tap and hold a measurement to configure. See
. Measurements include : Frequency, Period, Duty Cycle, Pulse Width, Negative Width, Mean, RMS, Cycle Mean, Cycle RMS, Standard Deviation, Peak to Peak, Amplitude, Maximum, Minimum, High Level, Low Level, Rise Time, Fall Time, Rise Rate, Fall Rate, Overshoot, Undershoot. -
What are the definitions of the Oscilloscope measurements?
Frequency
Frequency of the signal as determined by the time between rising or falling edges
Period
Time between pairs of rising or falling edges
Duty Cycle
Ratio of the time spent above the median to that spent below it
Pulse Width
Time the signal spends above the median
Negative Width
Time the signal spends below the median
Mean
Average value of the signal
RMS
Root-Mean-Square value of the signal
Cycle Mean
Average value of the signal, discounting partial cycles at the beginning and end of the frame
Cycle RMS
Root-Mean-Square value of the signal, discounting partial cycles at the beginning and edge of the frame
Standard Deviation
Mathematical description of the spread of the points in the signal
Peak to Peak
Difference between the highest and lowest voltage in the signal
Amplitude
Difference between the high- and low-level voltage, excluding over- and undershoot
Maximum
Highest voltage in the signal
Minimum
Lowest voltage in the signal
High Level
Highest voltage in the signal, excluding overshoot
Low Level
Lowest voltage in the signal, excluding undershoot
Rise Time
Time taken for the signal to transition from 10% to 90% of the way from minimum to maximum
Fall Time
Time taken for the signal to transition from 90% down to 10% from maximum to minimum
Rise Rate
Rate at which the signal transitions from 10% to 90% of the way from minimum to maximum
Fall Rate
Rate at which the signal transitions from 90% to 10% of the way from minimum to maximum
Overshoot
Distance the signal shoots above the maximum level before settling
Undershoot
Distance the signal shoots below minimum level before settling
Phasemeter
-
Can I measure the phase or frequency difference between the two input channels?
Yes! When both input channels are enabled, a Delta channel with the difference between Channel 1 and Channel 2 automatically appears. You can also plot the Delta channel alongside Channel 1 and 2 in the Timeseries and Spectral Analysis plots by selecting the Δ icon (color-coded orange).
-
How does Moku:Lab calculate the Power Spectral Density?
The Power Spectral Density (PSD) and the Amplitude Spectral Density (ASD) in the iPad phasemeter are calculated using Welch’s method of overlapping periodograms, with a 50% overlap and a Hanning window. The number of points is either 512, 1048 or 2048 depending on the sampling rate chosen.
A Python based example can be found here.
PID Controller
-
How can I invert my controller's response?
You can enter negative values into the control matrix to invert one or both input signals.
-
What do the different colored buttons mean when configuring a PID controller?
Often it is useful to be able to configure a controller's transfer function before implementing it. When the 'P', 'I', 'D', 'I+', 'IS', or 'DS' buttons are orange, any changes you make to those parameters will not take effect until you tap the button again and it turns green or purple.
Waveform Generator
-
What are my options for triggered burst mode?
• Start mode: start generating a signal from a trigger event.
• N cycle mode: Output a predefined number of oscillations for a given signal.
• Gated mode: Turn your output on/off depending on your trigger. -
What is triggered sweep mode?
Triggered Sweep Mode allows you to automatically sweep the frequency of your signal by setting a start frequency, a stop frequency and sweep duration. The source of trigger events can be selected from the following options:
• Internal: Trigger from an internally generated signal.
• Channel: Trigger from the waveform characteristics of the other channel
• ADC: Trigger from the analog inputs
• External: Trigger from the TTL compatible EXT input on the back panel.
Spectrum Analyzer
-
How do I track a peak?
Simply drag out a new marker from the marker button. Track multiple peaks on a single channel by dragging markers directly to the peaks you want. The Measurements Panel is also marker aware. Make measurements based on a marker’s characteristics such as amplitude, frequency, 3 dB width and SNR, or even the difference between markers. Swipe up from the measurement area to reveal the measurement history, a powerful enhancement to conventional zero-span measurements.
-
How do I generate waveforms on Moku:Lab’s analog outputs while running the Spectrum Analyzer?
Moku:SpectrumAnalyzer can be configured to generate two independent sine waves up to 250 MHz each on Moku:Lab’s analog outputs. In the Moku:Lab App, open the instrument Configuration Panel by tapping on the settings icon (located on the top-right corner of the screen). Select the Output tab, then configure and turn on the desired channel(s).